Introduction
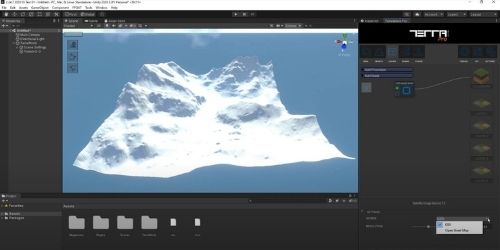
Go to the COLORS tab and add the SATELLITE IMAGE SOURCE node into the graph. The output satellite image comes from the latest captured layer on ESRI or OpenStreetMap servers, which in this case we leave it to ESRI source.

You can also define the resolution of the downloading image from the Settings section.


